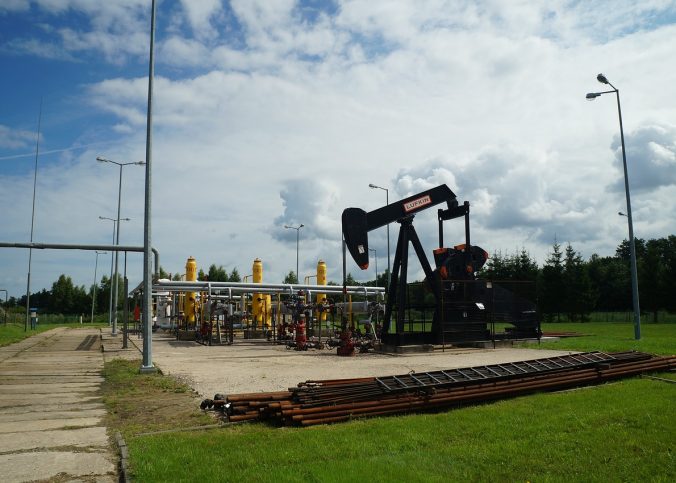
This page contains a Flash digital edition of a book.
Optimal Spatial Allocation of Wind Turbines Taking Externalities into Account


a report by


Jürgen Meyerhoff1 and Martin Drechsler2 1. Research Fellow, Berlin Institute of Technology;


2. Senior Scientist, Department of Ecological Modelling, UFZ–Helmholtz Centre for Environmental Research, Leipzig


The question is how this knowledge translates into a welfare-optimal spatial allocation of turbines that considers both production and external costs.2


Wind power is one of the most promising options across the globe for producing energy in a climate-friendly manner. The goals set by many governments to increase the share of energy generated by renewables within the next few decades will only be met if wind power production – both onshore and offshore – is expanded. However, its environmental benefits notwithstanding, wind power generation causes externalities such as impacts on humans and biodiversity. All studies conducted so far show that these externalities can be substantial.1


fields. Some of these areas may still be unsuitable due to legal constraints: for example, regulations that limit the noise level in residential areas mean that wind turbines must be situated a minimum distance from these areas, and in nature conservation areas the installation of wind turbines may be restricted or even forbidden. For the remaining, suitable areas in the planning region, wind data are gathered on a spatial grid and combined with the technological parameters of the wind turbines to determine the amount of wind power that could be produced at each potential site.


In this article we present a modelling approach for the determination of the welfare-optimal spatial allocation of wind turbines and apply it to Westsachsen, a planning region in Germany. The approach combines choice experiments (CEs), a non-market valuation method used to measure externalities of wind power, and spatially explicit ecological–economic modelling within an optimisation framework.3 Optimal is understood here as producing a given amount of wind power at the lowest social cost possible. Social costs comprise externalities – which are measured by the (monetised) impact of wind turbines on biodiversity, the minimum distance between wind turbines and settlements, the height of the wind turbines and the size of the wind farms – and the construction and operating costs associated with the wind turbines as well as standardised grid connection costs. Considering two state-of-the-art wind turbine technologies, we demonstrate that the social costs of wind power production can be reduced substantially if externalities are taken into account.


Modelling the Impacts and Production Costs of Wind Power Production


As a first step, potential sites for the installation of wind turbines are determined. Starting with the entire planning region, physically suitable areas for wind power production are identified, which in the case considered here include open land such as grasslands and agricultural


Jürgen Meyerhoff is a Research Fellow at the Berlin Institute of Technology, where he works in environmental and land economics. For the last 10 years he has worked on non-market valuation, applying both contingent valuation and choice experiments to topics such as enhancing forest biodiversity, extending floodplains along the river Elbe in Germany and the landscape externalities caused by wind turbines.


E: juergen.meyerhoff@tu-berlin.de


Martin Drechsler is a Senior Scientist in the Department of Ecological Modelling at the UFZ–Helmholtz Centre for Environmental Research in Leipzig. A physicist by training, his research interests include the mathematical modelling of ecological, economic and coupled ecological–economic systems, decision theory and the analysis of economic instruments for environmental policy.


E: martin.drechsler@ufz.de


Even if the legal minimum distances to settlements and conservation areas are respected, wind turbines have impacts on humans and biodiversity. In the case considered here, impacts on humans, among others, are determined by the distance between wind turbines and settlements (beyond the legal minimum), while impacts on biodiversity are measured by the collision risk and, ultimately, the population loss rate of the red kite – the bird species most affected by wind turbines in this particular study region. Wind power production costs include construction and operating costs. The data for the two considered technologies were obtained from the manufacturers. Grid connection costs were considered as a function of the distance from the wind turbine to the closest transformer station using typical estimates for cable costs.


Determining the External Costs


The above-mentioned impacts of wind turbines on humans and biodiversity were monetised through CEs based on the assumption that the utility to consumers of any good (including public goods such as a landscape) is derived from its attributes or characteristics. Due to this focus, CEs are particularly useful for valuing multidimensional changes.4


Respondents are asked to make


comparisons among environmental alternatives characterised by a variety of attributes and levels of those attributes. Typically, respondents are offered multiple choices during the survey, each presenting alternative versions of the environmental change in question and the option to choose the status quo. The record of choices serves as a basis for estimating the willingness to pay (WTP) among respondents. Changes in welfare due to a marginal change in a given attribute are calculated using the marginal WTP (MWTP) measure, which is defined as the maximum amount of income a person will pay in exchange for an improvement in the level of a given attribute provided.


The attributes and their levels that were used to design the choice sets in the study under discussion here1


are as follows: • 70


• size of wind farms: large farms (16–18 wind turbines), medium farms (10–12 wind turbines), small farms (four to six wind turbines); maximum height of turbines: 110m, 150m or 200m;


© TOUCH BRIEFINGS 2010


Wind


Page 1  |  Page 2  |  Page 3  |  Page 4  |  Page 5  |  Page 6  |  Page 7  |  Page 8  |  Page 9  |  Page 10  |  Page 11  |  Page 12  |  Page 13  |  Page 14  |  Page 15  |  Page 16  |  Page 17  |  Page 18  |  Page 19  |  Page 20  |  Page 21  |  Page 22  |  Page 23  |  Page 24  |  Page 25  |  Page 26  |  Page 27  |  Page 28  |  Page 29  |  Page 30  |  Page 31  |  Page 32  |  Page 33  |  Page 34  |  Page 35  |  Page 36  |  Page 37  |  Page 38  |  Page 39  |  Page 40  |  Page 41  |  Page 42  |  Page 43  |  Page 44  |  Page 45  |  Page 46  |  Page 47  |  Page 48  |  Page 49  |  Page 50  |  Page 51  |  Page 52  |  Page 53  |  Page 54  |  Page 55  |  Page 56  |  Page 57  |  Page 58  |  Page 59  |  Page 60  |  Page 61  |  Page 62  |  Page 63  |  Page 64  |  Page 65  |  Page 66  |  Page 67  |  Page 68  |  Page 69  |  Page 70  |  Page 71  |  Page 72  |  Page 73  |  Page 74  |  Page 75  |  Page 76  |  Page 77  |  Page 78  |  Page 79  |  Page 80  |  Page 81  |  Page 82  |  Page 83  |  Page 84  |  Page 85  |  Page 86  |  Page 87  |  Page 88  |  Page 89  |  Page 90  |  Page 91  |  Page 92  |  Page 93  |  Page 94  |  Page 95  |  Page 96  |  Page 97  |  Page 98  |  Page 99  |  Page 100  |  Page 101  |  Page 102  |  Page 103  |  Page 104  |  Page 105  |  Page 106  |  Page 107  |  Page 108  |  Page 109  |  Page 110  |  Page 111  |  Page 112  |  Page 113  |  Page 114  |  Page 115  |  Page 116  |  Page 117  |  Page 118  |  Page 119  |  Page 120  |  Page 121  |  Page 122  |  Page 123  |  Page 124
Produced with Yudu - www.yudu.com